This page for SDCs to show how they are using public library data in their state. Please identify your state when posting your information.
Connecticut
See National Chart-Maker (updated with 2012 data) to download 3MB Excel file. We made this resource for our libraries in CT, but it can be used by any library. Still in "beta" so we welcome comments. We are also using Tableau Public, a data visualization tool, on a trial basis. See our Data Visualization experiment.
Delaware
Library Menu and Dash Boards.pptx
In Delaware we’re organizing our data by Dewey (our own version of Dewey Delaware). The Reference Librarians are collecting reference stats by Dewey, in addition to what Bob can pull from our statewide ILS. This is a work in progress, once we align all the inputs and outputs by Dewey (Collection/Circulation; Programs/Program Attendance; Reference questions, etc.) then we plan to showcase for advocacy how Delaware libraries are impacting each of the Dewey DE areas. Then, we’ll work on how to move beyond outputs to determine outcomes at scale. That may likely require learning more about how each discipline defines outcomes and how they measure it, will require help from our partners.
Florida
https://public.tableausoftware.com/profile/katrice.stewart#!/vizhome/CountyLiaisonAssignments/CountyLiaisonAssignmentsDashboard
I've started to use Tableau Public to create some infographics. This map was created to show who the assigned consult is for a particular county. I can update the map on the fly and it will be live. It was SUPER easy.
Indiana
ISL Annual Report 2014.pdf 2014 Indiana Public Libraries Annual Report - Pocket-sized brochure created by the ISL Communications Director. Contains infographics, charts, and stories.
imls_powerpoint_eh122010.ppt (This PowerPoint was presented at the December 2010 SDC Conference "Show and Tell" Concurrent Session.)
Kentucky
Web page of graphs for each of Kentucky’s counties showing 25 year trends in expenditures, number of borrowers, circulation, attendance, and square footage
Louisiana
We took the data and made a pocket sized called Quick Facts. The 2008, 2009 and 2010 versions are posted on the publications page of the State Library web site. (You need to scroll to the bottom of the page.)
Massachusetts
Who Needs Libraries? We All Do! (on YouTube)
Rebuild library services for all residents – Funding Request for FY2013
State Aid to Public Libraries: A Guide for Municipal Officials
Missouri
Public Library Stats Overview
PublicLibraryStatsOverview_14AugStaffMtg (1).ppsx
North Carolina
North Carolina Points of Interest, Fiscal Year 2010 NC_pointsOfInterest2.pdf - February 2013
A two-page report for NC library directors to use in local advocacy. Joyce Chapman, SDC
NC public library data website: http://plstats.nclive.org
NC public library data dashboards:http://plstats.nclive.org/dashboard.php
The idea of the dashboards is to help the libraries use their data to make contextualized arguments for advocacy or management decision-making. They select a library and the dashboards give them performance indicators and allow them to also choose a comparison group. Then the dashboard also shows them the average for their comparison group, and their own library’s difference from that group mean. Same with census data about their community.
South Dakota
The South Dakota Public Libraries Data Digests (under Reports) and our South Dakota Annual Report (last item on the page under State Library Hightlights-2009) are available on the Publications page of library.sd.gov
(link to http://library.sd.gov/SDSL/publications/index.aspx#Reports).
Wisconsin
Wisconsin Public Library Service Trends
http://pld.dpi.wi.gov/sites/default/files/imce/pld/pdf/wiplservicetrends.pdf
Compiles data for 20 fields of the Wisconsin public library annual report by the four major types of U.S. Census locale codes—city, suburb, town, rural—for report years 2009-2014. Financial data is adjusted by the annual Consumer Price Index (CPI) for the size of municipality where the library is located as the equivalent in 2014 dollars.
Fast Facts About Public Libraries
http://pld.dpi.wi.gov/sites/default/files/imce/pld/pdf/wiplfastfacts.pdf
Based on 2012 Wisconsin Public Library Annual Report Data
Discovering Your Data: Where it is and what libraries can do with it
http://pld.dpi.wi.gov/sites/default/files/imce/pld/pdf/NWLS2014-Discovering%20Your%20Data.pdf
Presentation given at WAPL 2014 and as a webinar (PDF link above is slides from the webinar). See below for more examples of "Tufterized" charts.
http://plsc.pbworks.com/w/file/76008890/WI-ebook-stats-med.png
http://plsc.pbworks.com/w/file/76008884/WI-audiobook-stats-med.png
Graphs of Wisconsin e-book and audiobook data, "tufterized" as described in the http://insights.qunb.com/good-ol-excel-is-the-ultimate-data-visualization-tool-in-most-cases article shown by Census during the December 2013 SDC meeting. Graphs were created with Excel, saved as PDF files, then tweaked in Photoshop.
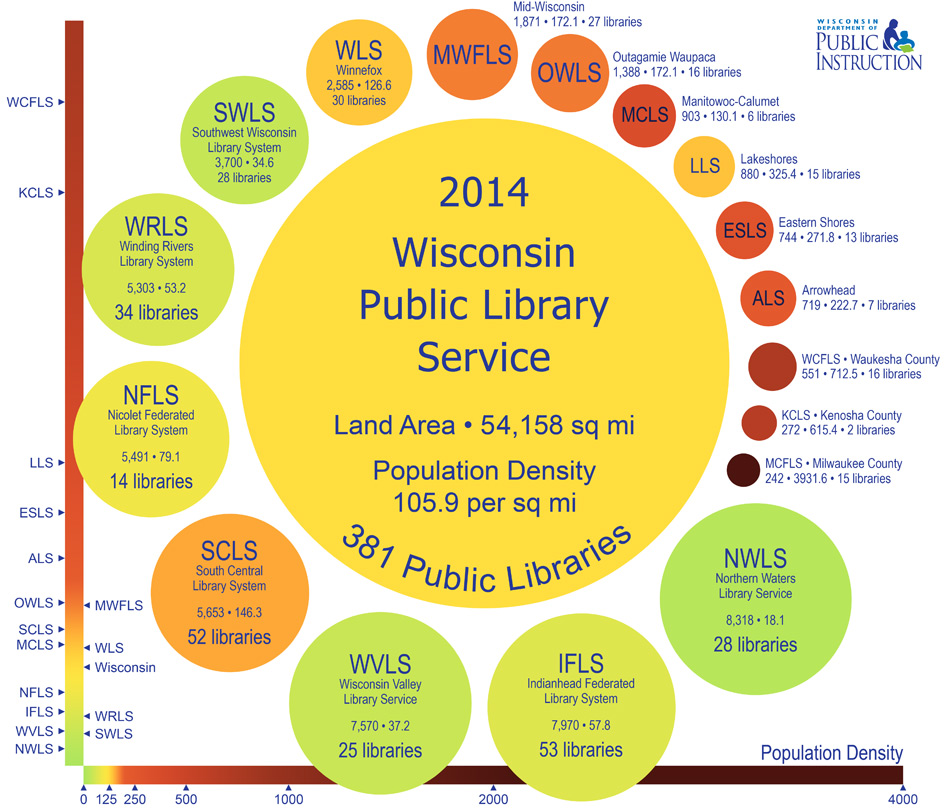
Infographic: Regional Library System Land Area and Population Density
http://pld.dpi.wi.gov/sites/default/files/imce/pld/images/sys_area_infographic.jpg
Created with Photoshop. The area of all circles including the center equals relative land area. The color of each circle corresponds to its position in the population density “heat map.” 2013 land area and population density data are listed for Wisconsin and each system. The heat map legend across the bottom illustrates the total range of population density. The legend at left is an expanded segment that shows each system’s population density in relation to the other systems (except for Milwaukee County Federated Library System).
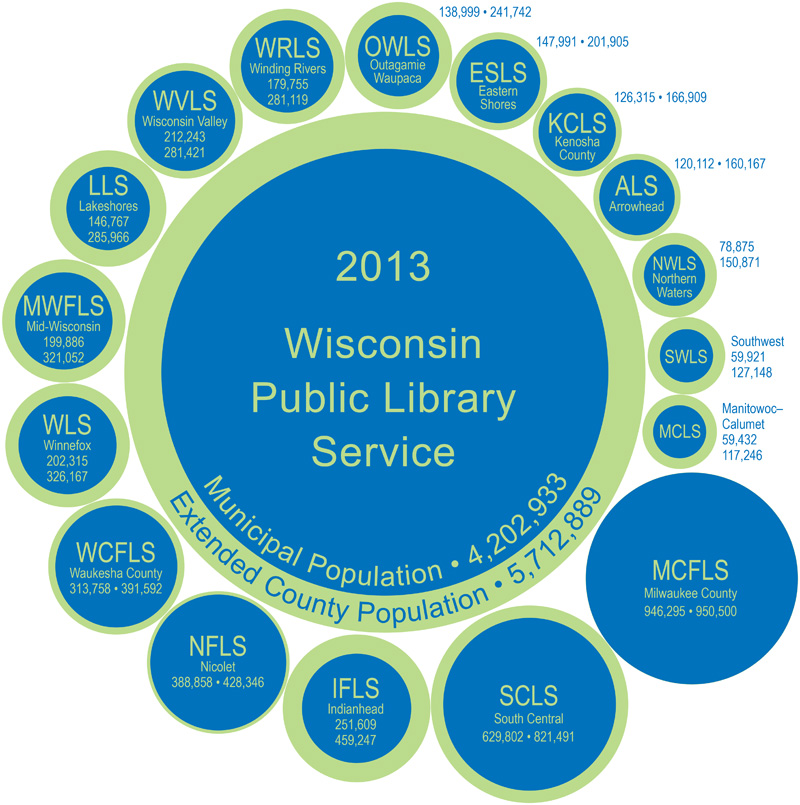
Infographic: Regional Library System Municipal and Additional County Population
http://pld.dpi.wi.gov/sites/default/files/imce/pld/images/sys_pops_infographic.jpg
Created with Photoshop. Regional systems are currently 1 to 10 counties. Area of blue circles represent total of library municipalities' resident population. Green rings are additional population served.
Annual report / LibPAS workshop 2016
http://dpi.wi.gov/sites/default/files/imce/pld/pdf/SCLS_2016_annual_report_workshop.pdf
The 2016 Annual Report: Before, During, and After.
- Public Library Services Funding Framework - The connection between annual reports and funding in Wisconsin
- Annual Report Calendar - Report-related communication between libraries and Wisconsin DPI
- Public Library Annual Report - What’s new, changed, or deleted ? Typical rough spots
- Online Reporting System - Hands-on exercises: navigation, report process, comparison reports
- X Number of Things to Remember - General guidance, checklist, and contacts
Wyoming
We had an awesome Snapshot Day, and we used our PLSC data to flesh out some of the numbers -- particularly our estimate for total library visits to all types of libraries.
Comments (0)
You don't have permission to comment on this page.